
Device Reports
How to export Device Reports using the Device menu
Device Reports
Device export functionality generates comprehensive reports of all devices within a TelemetryOS account, delivering structured data for inventory management, troubleshooting, and analytics workflows. Exports produce complete device fleet snapshots in machine-readable formats for integration with external systems.
Export Architecture
Device exports produce structured data files containing complete inventory of registered devices with operational status, configuration parameters, and performance metrics. This capability supports both human analysis and automated system integration scenarios.
Export Format Options
The export system supports two output formats optimized for different consumption patterns:
| Format | Structure | Optimal Use Case |
|---|---|---|
| CSV (Comma-Separated Values) | Tabular data | Spreadsheet applications (Excel, Google Sheets), database imports |
| JSON (JavaScript Object Notation) | Hierarchical structured data | Programmatic consumption, automation scripts, monitoring platforms |
CSV characteristics:
- Flat rows suitable for filtering and sorting
- Compatible with spreadsheet applications
- Human-readable tabular format
- Easy bulk manipulation
JSON characteristics:
- Nested object relationships preserved
- Data hierarchy and type information maintained
- Direct integration with automation scripts
- No parsing overhead for programmatic consumption
Both formats contain identical data schemas but differ in structural representation.
Exported files download to the browser's default download directory, following standard browser file handling behavior.
Export Use Cases
Inventory Management
Device exports deliver complete fleet inventories in portable formats:
Applications:
- Offline record-keeping and backup documentation
- Compliance reporting for audits
- Historical snapshots of fleet composition
- Change tracking over time
Organizations can maintain historical snapshots documenting fleet composition at specific points in time, supporting audit requirements and change tracking.
Health Monitoring
Export data includes operational health indicators:
Metrics included:
- Last seen timestamps
- Error counts
- Connectivity metrics
- Uptime percentages
- Performance indicators
Comparing exports over time reveals degradation patterns, recurring issues, or devices requiring attention before complete failures occur.
Deployment Analysis
Playlist assignment data within exports reveals content distribution patterns:
Analysis capabilities:
- Content reach by location
- Coverage gap identification
- Content targeting optimization
- Geographic deployment density
Location data supports geographic analysis of deployment density and service coverage.
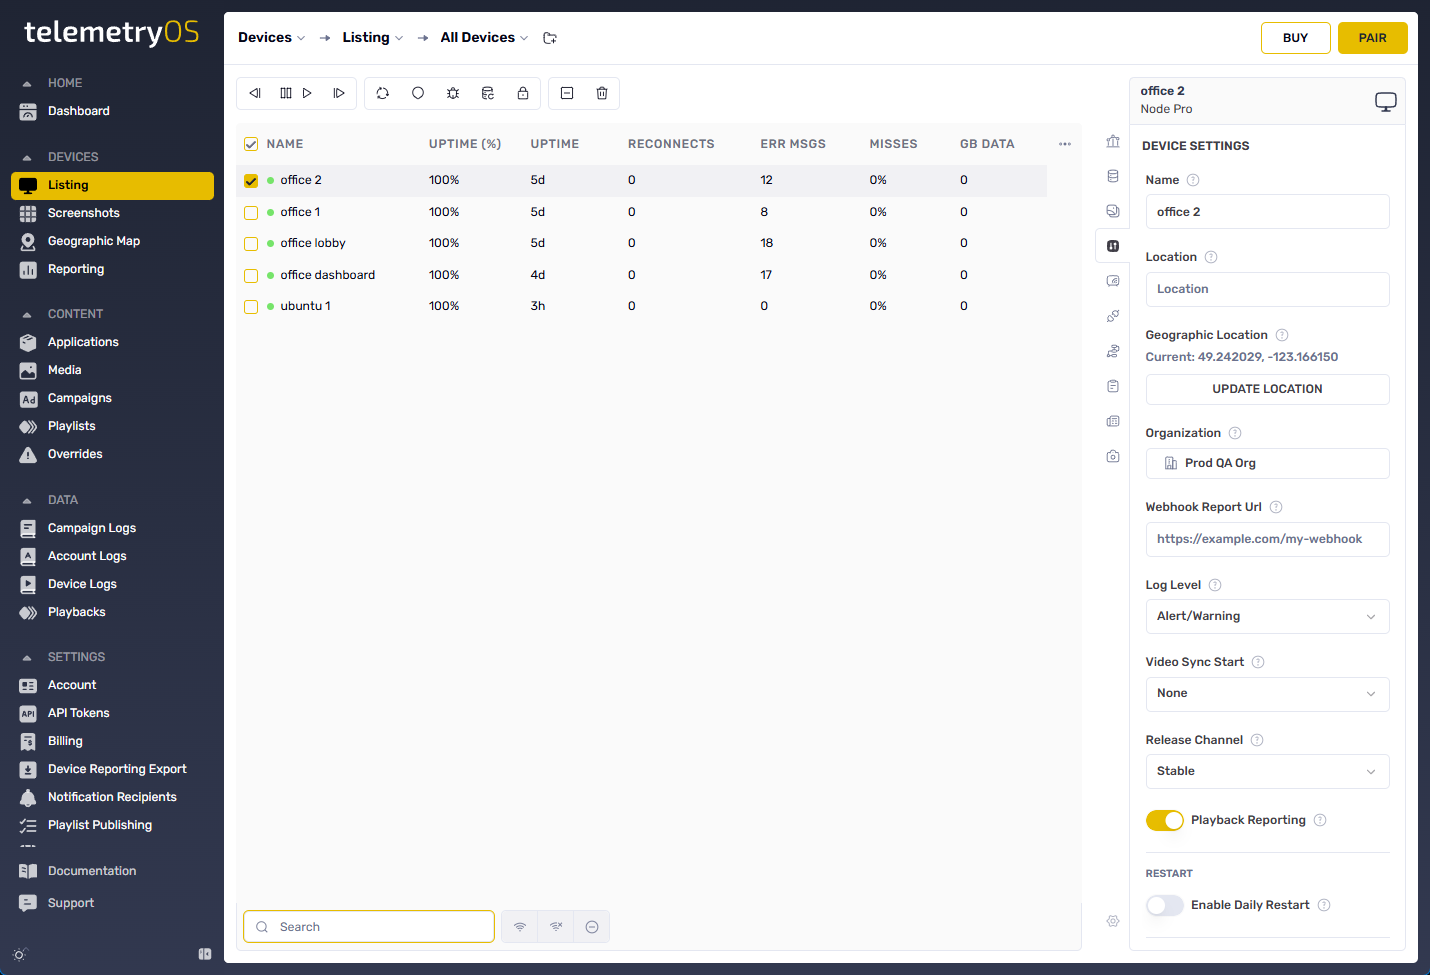
Device Report Parameters
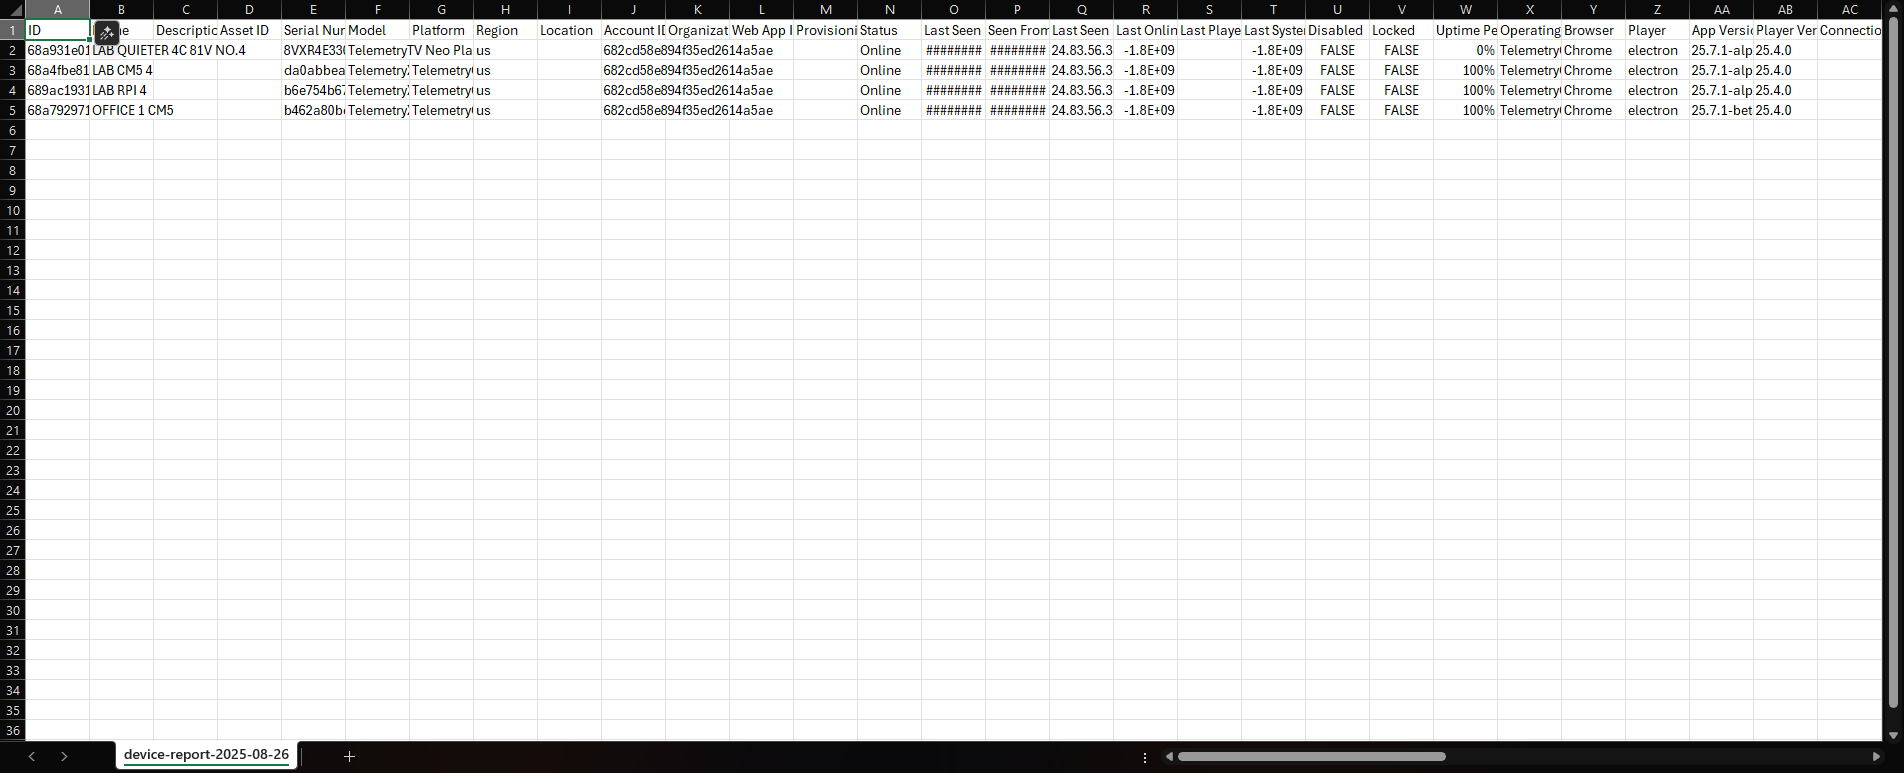
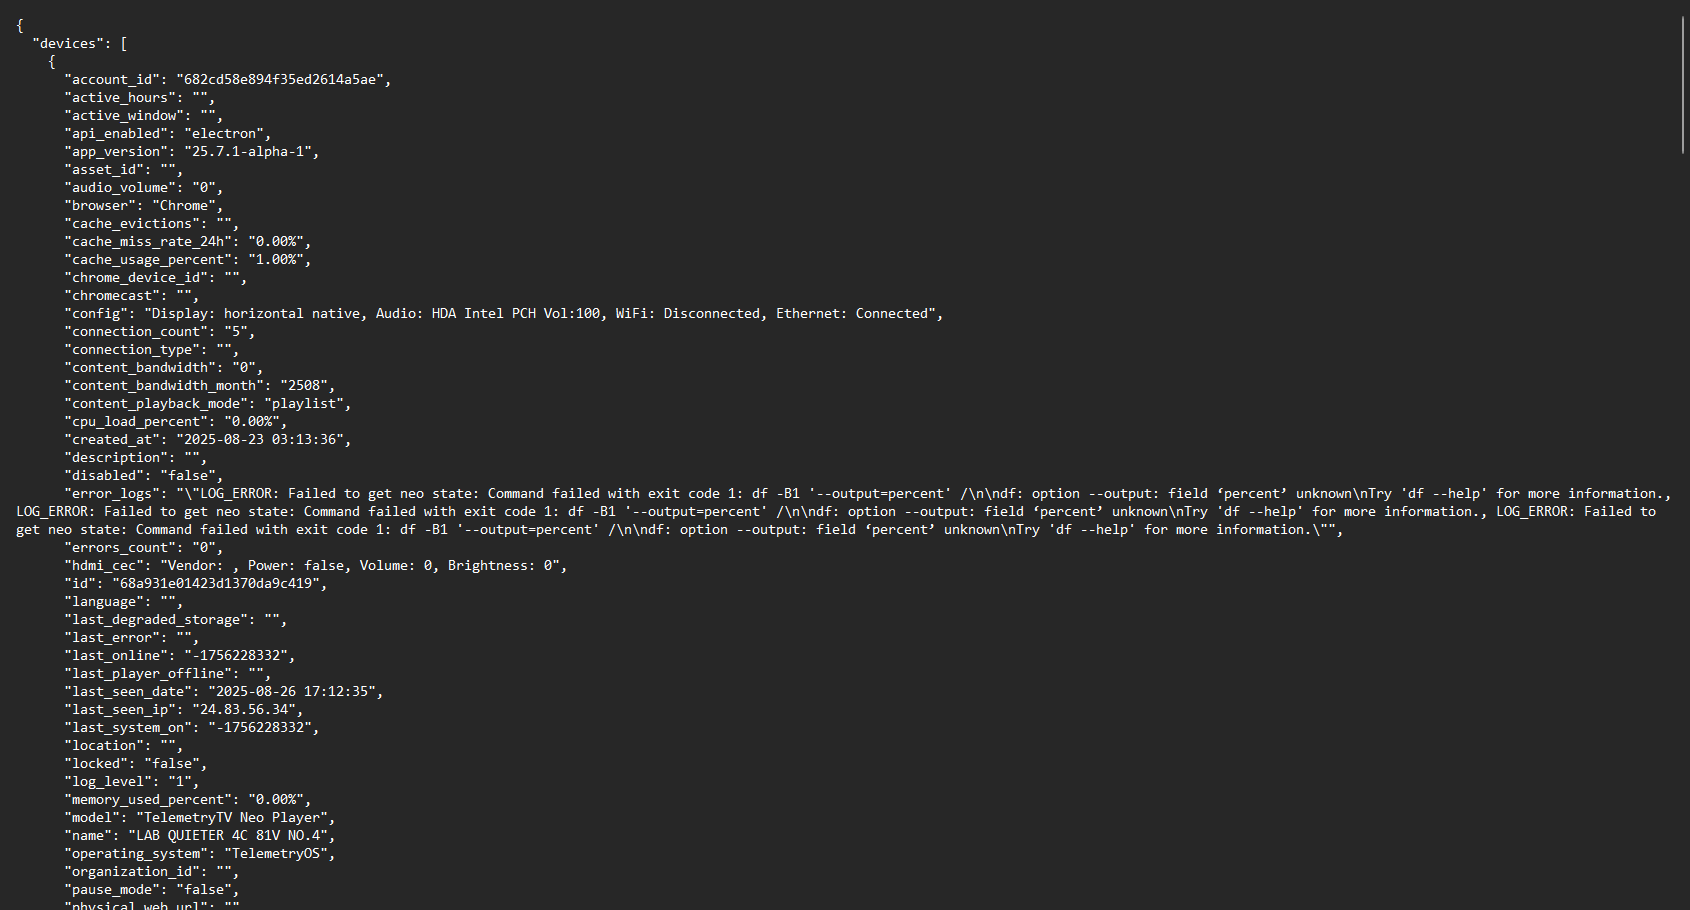
Exported CSV or JSON files include comprehensive device information organized across multiple fields:
| Field | Description |
|---|---|
| account_id | Unique identifier for the device (UUID/asset tag) |
| name | Human-friendly name assigned in the fleet |
| description | Optional device description |
| asset_id | Asset identifier assigned to the device |
| serial_number | Manufacturer serial or hardware ID |
| model | Hardware model (e.g., Node Pro) |
| platform | Current platform (e.g., TelemetryOS Edge) |
| region | Device region (e.g., US) |
| location | Assigned location or URL |
| organization_id | Organization ID association |
| web_app_id | Web app ID association |
| provisioning_id | Provisioning ID association |
| status | Operational state (Online, Offline, Inactive, Updating, Error) |
| last_seen_date | Timestamp when device last checked in |
| seen_from_date | Timestamp of first device check-in |
| last_seen_ip | Last IP address when device was online |
| last_online | Timestamp of last online status |
| last_player_offline | Last player when offline |
| last_system_on | Last system when online |
| disabled | Device disabled status (TRUE/FALSE) |
| locked | Device locked status (TRUE/FALSE) |
| uptime_percent | Percentage of time device was running |
| operating_system | Device operating system |
| browser | Browser used with device |
| player | Player used with device |
| app_version | Current app version |
| player_version | Current player version |
| connection_type | Connection type |
| chrome_device_id | Chrome device ID (if applicable) |
| chromecast | Chromecast connection status |
| player_channel | Player channel status (e.g., stable) |
| memory_used_percentage | Memory usage percentage |
| cpu_load_percent | Current CPU load |
| cache_usage_percent | Cache usage percentage |
| cache_miss_rate_24h | 24-hour cache miss rate percentage |
| connection_count | Number of connections |
| reconnects_count | Number of reconnections |
| cache_evictions | Cache eviction count |
| content_bandwidth_month | Monthly content bandwidth |
| content_bandwidth | Total content bandwidth used |
| playlists | Playlists used by device |
| playlist_ids | Playlist IDs used by device |
| content_playback_mode | Current playback mode |
| playing_until | Timestamp when device stopped playing |
| video_sync_start | Video sync start time |
| video_sync_end | Video sync end time |
| audio_volume | Current device audio volume |
| show_blank_screen | Blank screen display status (TRUE/FALSE) |
| show_interactive_menu | Interactive menu usage status (TRUE/FALSE) |
| playlist_schedules | Current playlist schedules |
| language | Language used |
| update_type | Update type |
| update_hour_of_day | Update hour of day |
| restart_time | Current restart time |
| active_hours | Device active hours |
| api_enabled | Enabled API |
| log_level | Log level applied to device |
| pause_mode | Pause mode usage (TRUE/FALSE) |
| tags | Included tags |
| active_window | Active window schedule |
| serial_commands | Serial commands |
| hdmi_cec | HDMI-CEC low-speed control protocol status |
| config | Device configuration |
| serial_connection | Serial connection information |
| physical_web_url | Physical web URL |
| last_error | Last error message |
| errors_count | Error count |
| last_degraded_storage | Last degraded storage timestamp |
| error_logs | Error logs associated with device |
| created_at | File creation timestamp |
| updated_at | File last updated timestamp |
Common Integration Patterns
Spreadsheet analysis: CSV export → Excel/Google Sheets → Pivot tables and filtering
Monitoring integration: JSON export → Script parsing → Monitoring platform ingestion
Backup documentation: Periodic exports → Versioned storage → Historical fleet records
Compliance reporting: CSV export → Filter by criteria → Audit documentation
Health dashboards: JSON export → Visualization tools → Real-time health displays
Configuration Specifications
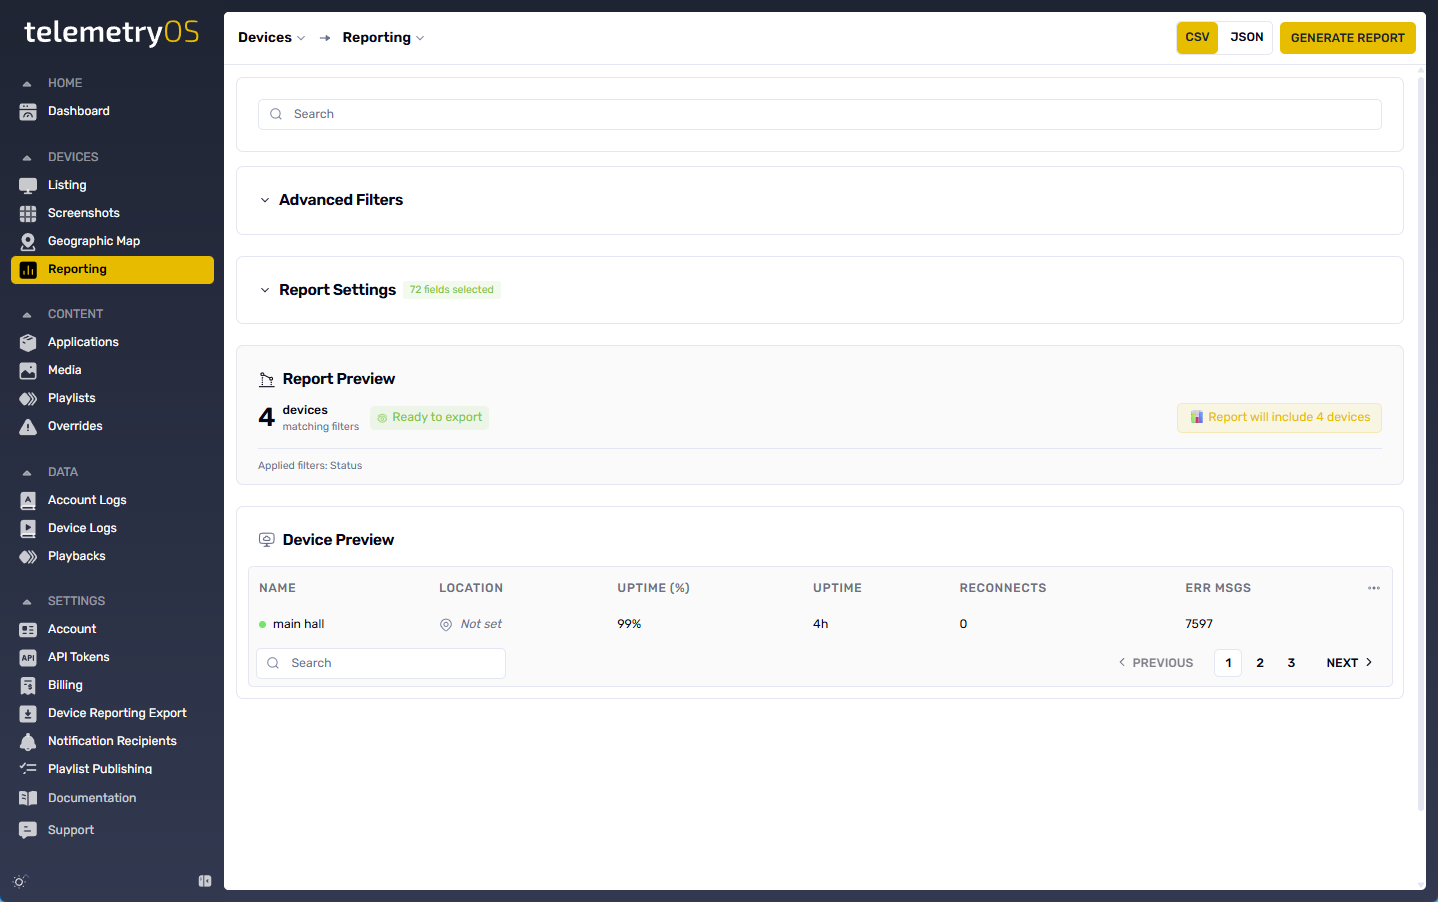
Device reports generate through Devices interface (Devices > Export button).
Export Options
- CSV format (tabular data)
- JSON format (structured hierarchical data)
Export Scope
- All devices in account (no filtering during export)
- Current state snapshot (not historical data)
Limitations
- Export captures current state only (not time-series data)
- No scheduling or automation (manual export only)
- Large fleets may take 10-30 seconds to generate
- File size scales with device count (100 devices ≈ 100KB CSV)
- No incremental exports (always full fleet)
- Browser download location determined by browser settings
- No built-in encryption (files contain sensitive device data)
- Export frequency not rate-limited (can export repeatedly)
- No filtering during export (filter data after export in analysis tools)
- Maximum export size: all devices in account (no hard limit, but very large exports may timeout)